


John Prather subscribed to The Kelly Letter in 2008. That’s him pictured above.
He arrived with years of stock investing experience under his belt, and has been through several market cycles with the letter’s system. Here’s his background:
- PhD in chemistry.
- Worked for Ciba, DuPont, and Invista, a division of DuPont bought by Koch Industries.
- Did a stint as a financial analyst for a “very large intermediates business that supplied monomers to the polyester world.”
- Began investing in 1974, out of graduate school.
- Inspired by President Nixon saying, “If I had money, I would put it in the stock market.”
- First stock was National Semiconductor, now the “Silicon Valley” division of Texas Instruments.
- Made enough money in National Semi to relocate to Alabama for a better job.
- That made a believer of him: “I never looked away from the markets as a potential source of income.”
- Good money management enabled him to retire at 62 and focus on investing.
He navigated the slow ’70s, hyperinflation of the early ’80s, Black Monday on 10/19/87 (the Dow’s largest single-day percentage drop in history: -22.6%), the “storming late ’90s” when the Nasdaq rose 400%, the 2000 Dot Com bust when the Nasdaq fell 78% and Cisco Systems lost 86% of its stock value, the subprime mortgage crash of 2008, the 2018 tech wreck, the Covid crash of 2020, and now along with the rest of us he’s going through the current turbulence.
Over five decades of investing, he’s learned a lot about managing volatility and concluded that emotions are an investor’s top challenge:
“So how do you live through all this as an investor? Emotionally, it ain’t easy. Emotions are usually one of your worst enemies—and they usually don’t get the best of you ’til after it’s too late.”
He recommends that newcomers teach themselves in no uncertain terms that they cannot time the market:
“If you think you can call bottoms and tops, try an experiment that I have tried: hedging. When your emotions tell you it is time to sell, buy some S&P 500 -2x (SDS $43 +21% YTD). When you think the worst is over, sell the SDS, i.e. call the bottom. Don’t buy much. Just test yourself. Keep score. Do this for a year or two and prove to yourself, as I did, that you cannot reliably make any money at this game.”
As a scientist, John loves experiments. He tested himself trading e-minis on one-minute time frames. “Did not work.” He traded corn, cotton, and currency futures. “Did not work.”
What ended up working for him were “deliberate systems that run on a well-tested signal; Sig comes to mind. These systems help my emotions. I just follow them.”
He advises to keep expectations realistic. He bears in mind the Rolling Stones song, “You Can’t Always Get What You Want” and its follow-on lyric, “But if you try sometimes, well, you might find … you get what you need.” He writes:
“So figure out what you need and go for it. The market has returned an average annual 10% over a lot of years. So that might be a good expectation. Learn to live with it. If you do better, that’s gravy. And you can do better, but likely not 20% a year on average by calling tops and bottoms. Go for systems that you can follow and follow them. Jumping around hoping lightning strikes does not work.”
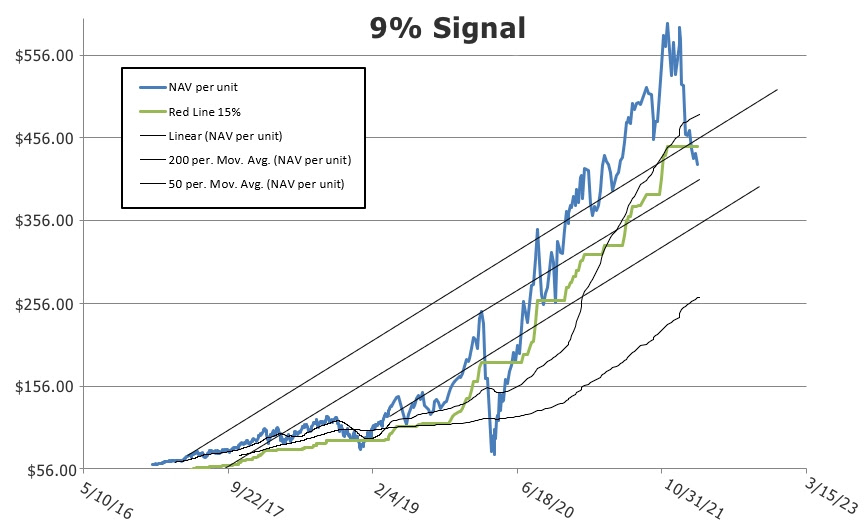
Every Saturday, he makes a report for himself to see the state of his portfolio. The following shows how he tracks 9Sig:
Here’s his explanation:
“The graph above is weekly NAV since I started 9Sig. I use the NAV/unit system to smooth out the data. The three straight lines are centered by the least squares fit of the data. And the moving averages are in there, too. The green line is a trailing stop that I fit to the data.
“Why do I do this? It gives me a longer-term view.
“Like right now, we have broken through my trailing stop but I can see I am still making money, and the moving averages have not rolled over and we seem to be returning to the mean after a big run-up.
“So there are several good signs there to help my emotions. I will be looking to add new money when I see TQQQ hated and forgotten after all the sellers are gone and it begins a new uptrend, just like I did in 2020.
“I think by keeping a longer-term view it helps me deal with emotions. And guess what? This approach has led to a ~45% compound annual growth for me since inception until last Saturday. I call this plan my ‘Jekyll and Hyde’ account. Hate it when Mr. Hyde is running the show, but got to remember that most of the time it is Dr. Jekyll’s turn.”
He’s learned that “volatility can be your friend.” It’s what provides chances to grow your money:
“Learn all you can about how volatility is calculated and estimated and those estimates applied. Quite a few Nobel Prizes have been won for better ways to estimate the volatility of a varying time series (stock prices).
“Once you get a good understanding, you will see that volatility creates the opportunity to buy low and sell high. Without volatility you would just be buying bonds and holding to maturity or depending on dividends. Embrace volatility and make it work for you. Don’t run from it.
“I think Jason often asks for some volatility so he can get a bargain price. Worse that can happen is 30 Down, Stick Around and look what that did for us in late ’20 and ’21. It was a bonanza.”
True, I do write about our plans needing periodic downside. Heading into this very quarter I did so. All of our Sig growth plans were heavy on cash and we needed lower prices to draw in their buying power. We’re getting it, and the buying power is eager and ready to go.
John notes that the simple key to the Sig system is to buy low and sell high:
“It ALWAYS tries to buy low and sell high. But this does not mean that you get to keep all your winnings all the time. Nothing goes straight up. But over time, buying low and selling high is the right thing to do, and the Signal plan does it in a systematic way, just following the signal, no predicting.”
He’s a fan of Yogi Berra’s observation: “It’s tough to make predictions, especially about the future.”
Thank you, John, for taking time to share a lifetime of investing wisdom.
Everyone else: I hope it helps. Remember, if you’re having a tough time you can always email me.
With you all the way,


3 Comments
Thank you Jason and Dr. Prather. Great article! I see the utility in using Net Asset Value instead of price alone as an analysis tool that strives for valuation accuracy and greater precision. I wonder though if it is statistically more accurate or precise enough to really make a difference in our brains “rational feel good meter”. I have degrees in chemistry and engineering as well so accuracy in my analysis world was important. However, precision in our analysis was relative to the requirements of our analysis product. For example a stress analysis needed to be accurately modeled and calculated. But the precision of the analysis was often plus or minus 3% to 5% because of the course nature and potential variability in the nature our input parameters. It would seem that with the variable nature of stock market prices from hour to hour, day to day and week to week that precision in net asset value instead of market value might not yield a set of curves that would vary much from one another. It would be very interesting to see a graph of weekly NAV data compared to weekly market price data. Yea, I’m retired and have time to ponder these things now.😊
Jason, I for one would rather leave all that fancy charting to John Prather. I’m just happy to follow your letter recommendations every Sunday. I don’t even look at my portfolio because it has no impact until we have to take action. Thank you.
Thank you for commenting, Henry.
Different strokes, I suppose. John also follows the plans, but enjoys an upfront, careful analysis of them in his own way. In the end, all of us get to the same place by sticking with the plans.