

On March 3, I wrote an article called Ultra Financials Stretch, from which the following:
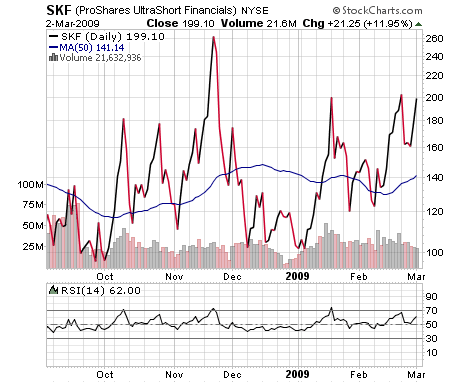
To give you an indication of where we are in this market, consider the popular ProShares UltraShort Financials ETF (SKF). Here’s its six-month chart:
Notice that it’s back up at the $200 line, a level it pierced only in November’s crescendo crash, but turned back from sharply in January and February. Unfortunately, each of those tops was accompanied by an RSI higher than the current 62. Nonetheless, anybody holding this would be wise to have a trailing stop in place.That being so, the opposite trade beckons, does it not? SKF’s inverse, ProShares Ultra Financials (UYG) should now be nearing oversold conditions at an RSI of 30, and it is: 33.
Consider this week to be the snap back. Here’s how SKF’s six-month chart looks now:

SKF holders were glad to have placed a trailing stop, I’m sure! It rode to the peak of $250 and then bailed out at the beginning of the crash. The opposite trade, UYG, got down to an RSI of 29 and a price of $1.51 on Monday. It closed yesterday at $2.35.


